Alexander Lam
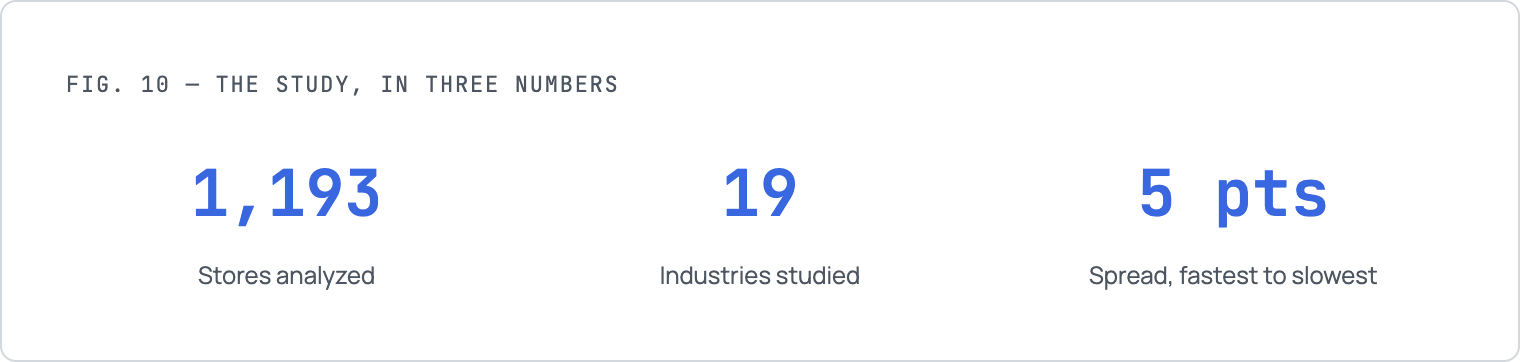
Shopify speed by industry: we analyzed 1,193 stores across 19 industries to test whether what you sell determines how fast your store loads. It doesn’t. See what actually predicts Shopify performance, including image weight, app count, and CSS, and what to prioritize first.
Key Takeaways
→ Industry barely predicts speed. The gap between the fastest and slowest industries was just 5 points on a 100-point scale, and Fashion & Apparel, despite the heaviest image payload in the study, landed almost exactly in the middle.
→ Image weight and app count don’t predict it either. Both showed correlations near zero (-0.117 and -0.102) against PageSpeed score across all 1,193 stores.
→ What actually separates fast stores from slow ones is resource prioritization, deferring non-critical scripts, lazy loading images, and prioritizing critical CSS, not how much a store loads, but the order it loads in.
Does Your Shopify Industry Affect Store Speed?
Fashion isn’t slower. Electronics isn’t faster. Almost every Shopify industry has the same performance problem.
If you run a fashion store on Shopify, you’ve probably assumed you’re starting at a disadvantage. Large product galleries. Lifestyle photography. Lookbooks. Size charts. Video. Compared to a bookstore or supplement brand, it seems inevitable that a visually rich fashion storefront would load more slowly.
It’s a reasonable assumption. It also wasn’t supported by our research.
Methodology: This analysis builds on our earlier audit that first identified the 30-point average PageSpeed score across Shopify stores. For this report, we expanded that dataset to 1,193 live Shopify stores across 19 industries and went deeper: assessing each store for PageSpeed performance and key technical characteristics, including image payload, app usage, and stylesheet count, to determine whether the products a merchant sells influence storefront performance.
The findings challenged one of the most common assumptions in ecommerce. The difference between the fastest and slowest industries was just five points on Google’s 100-point PageSpeed scale. Fashion, despite carrying the largest average image payload in our entire dataset, ranked almost exactly in the middle. Several industries with much lighter storefronts performed worse.
That prompted a deeper investigation. If industry wasn’t the deciding factor, perhaps image weight was. It wasn’t. Maybe app count explained the gap. That wasn’t it either.
The biggest differences between fast Shopify stores and slow ones weren’t explained by what merchants sold.
They were explained by how their storefronts were built, and what the browser was asked to load first. If speed were largely determined by industry, there would be a limit to how much improvement any merchant could realistically achieve.
Our research suggests the opposite: across nearly every category we studied, the greatest opportunities came from technical execution rather than unavoidable complexity.
Every Shopify industry performs surprisingly similarly
The first question was also the most obvious. Does the industry you’re in determine how fast your Shopify store is likely to be?
To answer it, we grouped every store into one of nineteen industries and compared their average Google PageSpeed scores.
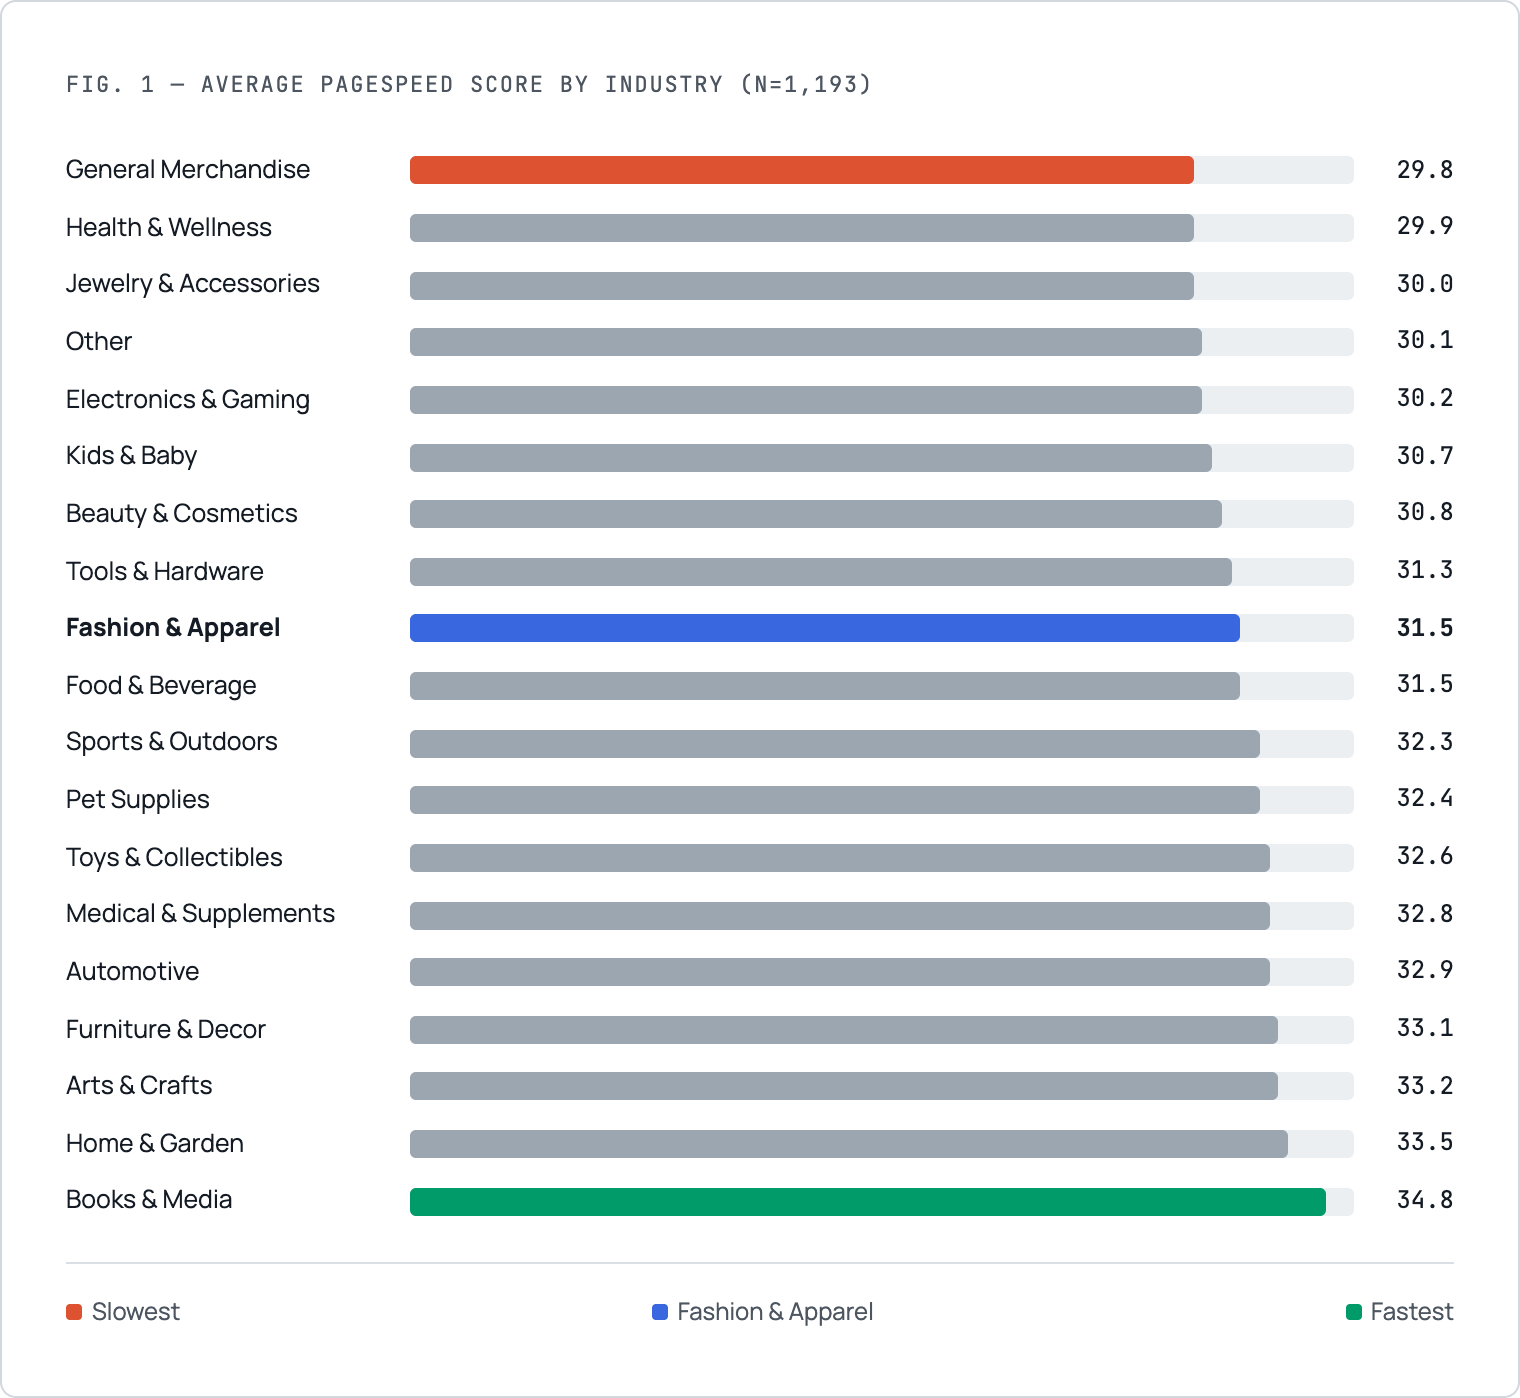
*Table shows the 19 industries with n ≥ 20 stores; categories below that threshold are omitted for statistical reliability. Category counts sum to 1,150 of the 1,193 stores with complete performance data.
At first glance, the rankings appear to show clear winners and losers. Look a little closer and a different picture emerges.
The fastest industry in our study, Books & Media, averaged 34.8. The slowest, General Merchandise, averaged 29.8. That’s a difference of just five points on a one-hundred-point scale. The median industry score sits at 31.5, meaning the typical Shopify industry scores only about 31 out of 100.
That became one of the most important findings in the entire study.
Merchants often compare themselves against competitors in the same category, assuming their products or customer experience naturally make performance more difficult.
Our data suggests industry has far less influence than most people think. Whether a store sells clothing, furniture, supplements, books, pet supplies, or automotive parts, almost every category falls within the same narrow performance band.
The bigger story isn’t that one industry consistently outperforms another. It’s that nearly every industry is underperforming.
That changes how these numbers should be interpreted. A fashion merchant shouldn’t benchmark only against other fashion stores, and a beauty brand shouldn’t assume its product pages are inherently lighter than those in furniture or sporting goods.
The benchmark isn’t your category. It’s how efficiently your storefront delivers content, regardless of what that content happens to be.
Which raises a more interesting question: if industries perform so similarly, what actually explains the difference between a store scoring in the nineties and another struggling to reach thirty?
The first assumption we tested was image weight
Before analyzing the data, we expected Fashion & Apparel to rank near the bottom. It carries the largest product catalogues, the highest image counts, and some of the most visually demanding storefronts on Shopify. If any industry were paying a performance penalty for rich content, fashion seemed like the obvious candidate.
Instead, it landed almost exactly in the middle of the rankings, outperforming General Merchandise, Health & Wellness, Jewelry & Accessories, Beauty & Cosmetics, Electronics & Gaming, and several other industries with considerably lighter pages.
That result forced us to look beyond industry averages. Perhaps image-heavy stores were still slower overall, regardless of category. To test that theory, we compared image payload against Google PageSpeed scores across all stores in our dataset.
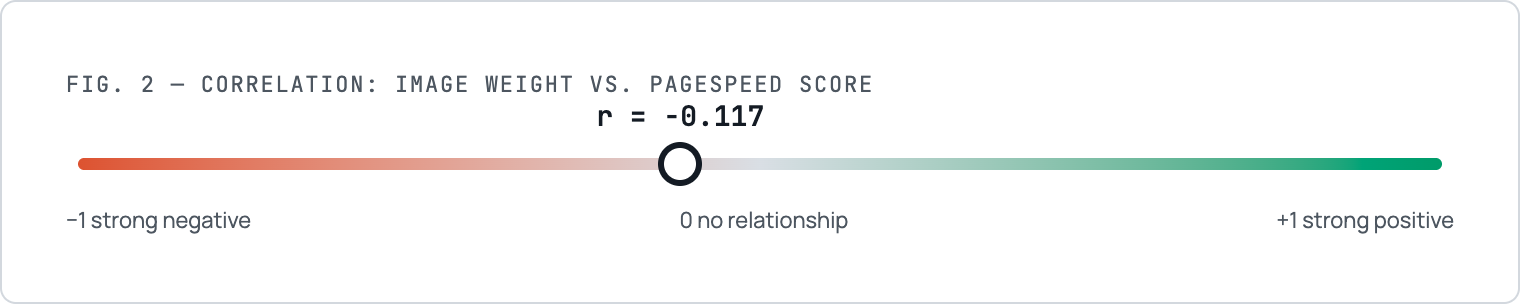
The relationship turned out to be surprisingly weak. The correlation between image weight and Google PageSpeed score was -0.117.
For context, correlation values range from -1 to 1. Values close to -1 indicate a strong negative relationship, values close to 1 indicate a strong positive relationship, and values near 0 indicate that two variables have little meaningful relationship at all. At -0.117, image weight barely predicts storefront performance.
That doesn’t mean images don’t matter. Large, unoptimized images can absolutely hurt an individual store. What the data reveals is more nuanced: across more than twelve hundred live Shopify stores, image weight alone does a remarkably poor job of explaining why one storefront performs well while another performs badly.
If images weren’t the answer, the next obvious suspect was third-party apps.
Apps weren’t the answer either
Third-party apps are often blamed for slow Shopify stores, and for good reason. Review widgets, loyalty programs, email capture forms, wishlists, accessibility overlays, analytics tools, and consent banners all introduce JavaScript, network requests, or both. Install enough of them and it’s easy to assume performance will suffer.
Many merchants have experienced this firsthand. A store launches with only a handful of apps and feels responsive. Months later, after marketing tools, personalization, reviews, subscriptions, upsells, and customer support have been added, performance begins to slip. “More apps equals a slower store” feels intuitive.
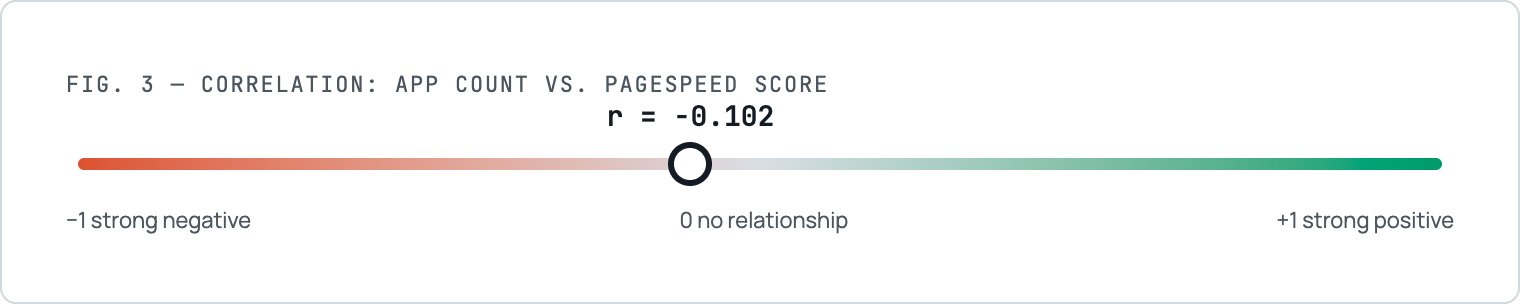
So we tested it. Across all stores in the data set, we compared the number of detected storefront apps against Google PageSpeed scores. The correlation between app count and PageSpeed score was -0.102, again a relationship so close to zero that it explains very little on its own.
This doesn’t mean apps are “free.”
Every additional script still consumes bandwidth, CPU time, or memory somewhere in the loading process. What the findings suggest is that the number of apps installed is a poor predictor of overall storefront performance.
A merchant running twelve well-managed apps can outperform another running six poorly implemented ones. Two stores using the same review platform or loyalty program can produce dramatically different PageSpeed results depending on how those scripts are loaded.
Throughout the dataset, we repeatedly found stores using remarkably similar technology stacks while achieving vastly different performance scores. Some scored in the nineties, while others struggled below ten, despite selling similar products and relying on many of the same third-party services.
By this point, three of the most common explanations had largely fallen apart. Industry barely explained performance. Image weight barely explained performance. App count barely explained performance.
So we shifted our attention to something merchants rarely see: not how much content stores loaded, but how they prioritized it.
What browsers actually compete for
Modern browsers don’t simply download one file after another.
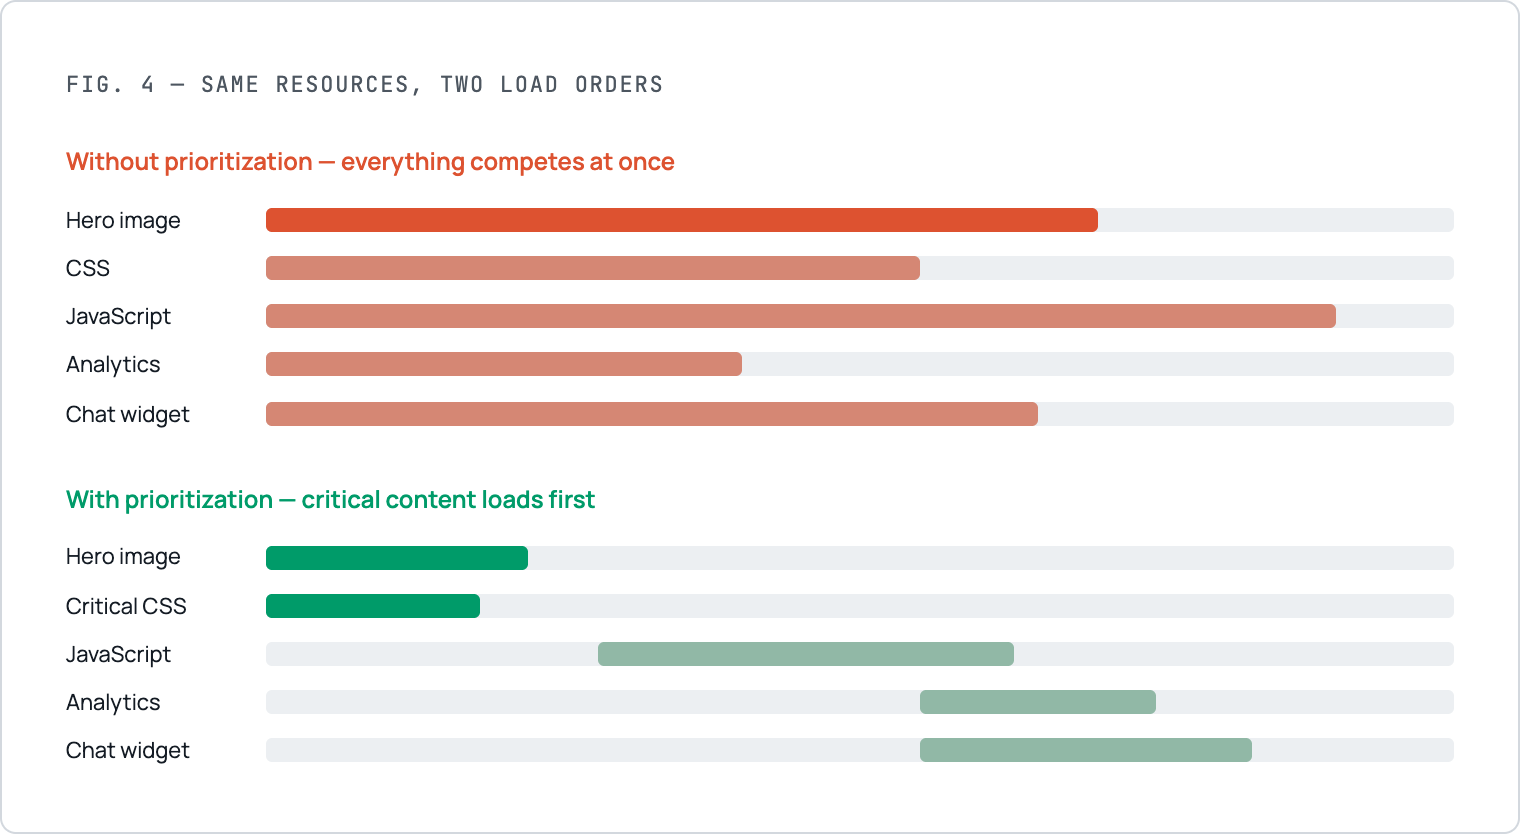
Every page competes for limited bandwidth, processing time, and rendering resources. Images, JavaScript, CSS, fonts, analytics scripts, review widgets, consent banners, chat tools, and marketing pixels all compete for attention during the first few seconds after a shopper lands on a page, before that shopper ever sees the first product image.
One of the clearest examples is the Largest Contentful Paint (LCP) image.
On most Shopify stores, this is the hero banner or primary product image that dominates the visible portion of the page. Google uses this element as one of the primary measurements of perceived loading speed because it’s often the moment shoppers feel a page has finished loading.
By default, browsers don’t discover images until they’ve parsed the page. Preloading changes that by telling the browser to request the most important image immediately, reducing unnecessary delays and increasing the likelihood that shoppers see meaningful content sooner.
We wanted to know how many merchants were actually taking advantage of it.
Hero image preloading remains surprisingly rare
Across all nineteen industries, hero image preloading was one of the least adopted optimizations we measured. A handful of industries showed modest adoption:
- Furniture & Decor: 11.5%
- Pet Supplies: 10.5%
- Tools & Hardware: 7.7%
- Automotive: 6.7%
- Health & Wellness: 6.2%
Nine industries recorded 0% adoption:
- General Merchandise
- Electronics & Gaming
- Kids & Baby
- Sports & Outdoors
- Toys & Collectibles
- Medical & Supplements
- Arts & Crafts
- Books & Media
- …others
Not one store in those categories preloaded its primary image.
That finding gets more interesting next to the rankings.
- Books & Media finished as the fastest industry overall despite showing no preload adoption whatsoever.
- Tools & Hardware ranked near the middle despite one of the highest preload adoption rates.
Preloading isn’t a silver bullet; performance is cumulative, and dozens of small decisions combine to determine the final result.
Its low adoption rate is also encouraging for merchants.
Unlike many optimizations that have become standard practice, hero image preloading remains uncommon across Shopify.
For merchants in those nine industries, it represents a meaningful, largely untapped opportunity to improve one of the most important loading metrics before it becomes commonplace.
Stylesheet count tells the same story
Next we examined CSS.
Stylesheets are essential for rendering modern storefronts, but they can also delay visual rendering when the browser must download and process them before displaying content. Heavy CSS isn’t automatically a problem, but unnecessary or render-blocking stylesheets frequently contribute to slower perceived performance.
- Arts & Crafts averaged 20.8 stylesheets, the lightest CSS footprint we measured
- Tools & Hardware averaged 38.7, the heaviest
- Other category close behind at 37.0.
Once again, the expected relationship failed to appear: despite carrying the largest stylesheet load, Tools & Hardware still ranked in the faster half of all industries, while Arts & Crafts, despite loading far fewer stylesheets, ranked slightly lower.
- Large image payloads don’t reliably predict performance.
- More apps don’t reliably predict performance.
- Higher stylesheet counts don’t reliably predict performance.
Each factor contributes something; none explains very much on its own.
A store with heavier images, more apps, and additional CSS can still outperform a technically lighter competitor if it prioritizes critical resources, delays non-essential work, and avoids forcing the browser to process everything simultaneously.
The conversation shouldn’t be about which industries are slow. It should be about which loading strategies consistently produce better-performing storefronts, regardless of industry.
A disappointing PageSpeed score isn’t necessarily a reflection of the products you sell or the complexity of your catalogue.
More often, it’s a reflection of the order in which your storefront asks the browser to do its work, and unlike your industry, that’s something you can actually control.
Why industry still matters, even if it doesn’t predict speed
By this point, several of the most common explanations merchants point to had been ruled out. Industry wasn’t a strong predictor of performance. Neither were image weight, app count, or stylesheet count when examined in isolation.
That doesn’t mean industry is irrelevant. It means industry influences something different: the cost of being slow.
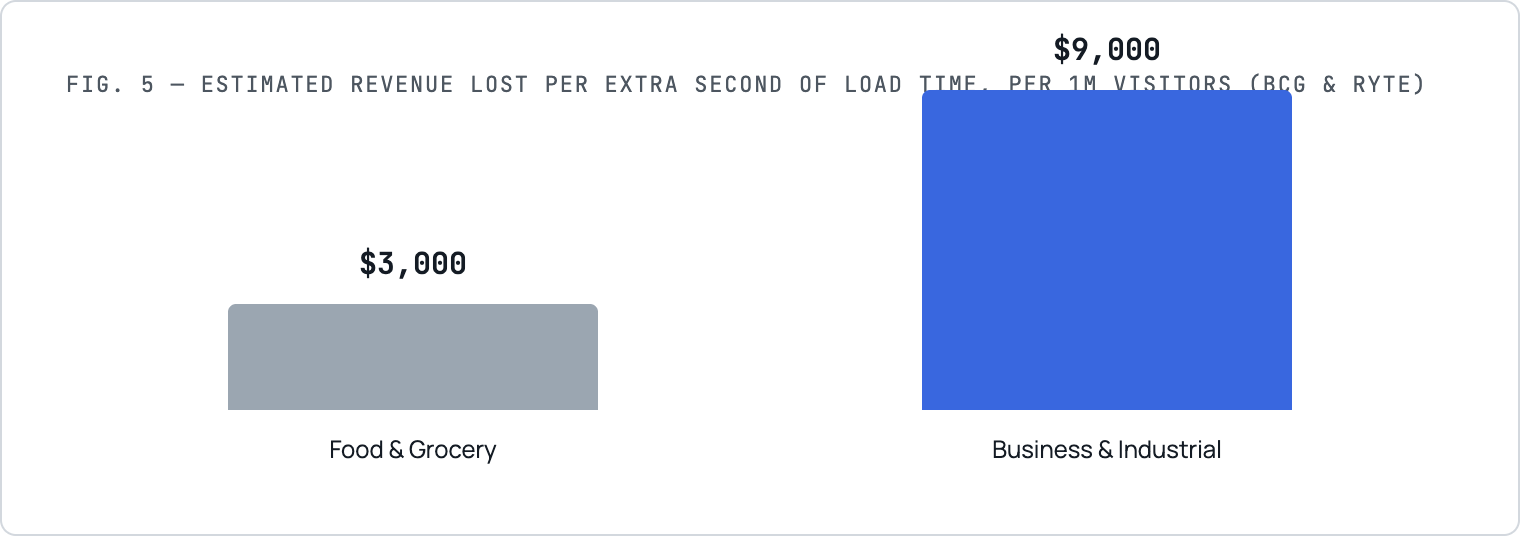
Two Shopify stores can earn the same PageSpeed score but experience very different business outcomes. A Google-commissioned study by BCG and Ryte found that every additional second of page load time costs food and grocery websites roughly $3,000 in lost revenue per one million visitors, compared with $9,000 for business and industrial websites. The delay is the same, but the financial impact differs because customer expectations, buying behaviour, and purchase value vary across industries.
Google and Deloitte reached a similar conclusion in their widely cited Milliseconds Make Millions research, which analyzed more than 30 million mobile user sessions. Improvements as small as 0.1 seconds were associated with measurable gains in conversion rate, average order value, and customer engagement across industries.
Our research helps explain what separates fast Shopify stores from slow ones. Those studies help explain why merchants should care.
A slow product page doesn’t carry the same commercial consequences for every business. An impulse purchase with dozens of competing alternatives leaves very little room for friction. A considered purchase with a longer buying journey may tolerate a slower experience before customers abandon the page.
Understanding that distinction helps merchants prioritize optimization without falling into the trap of assuming their industry determines what’s technically possible.
What merchants in each industry should prioritize
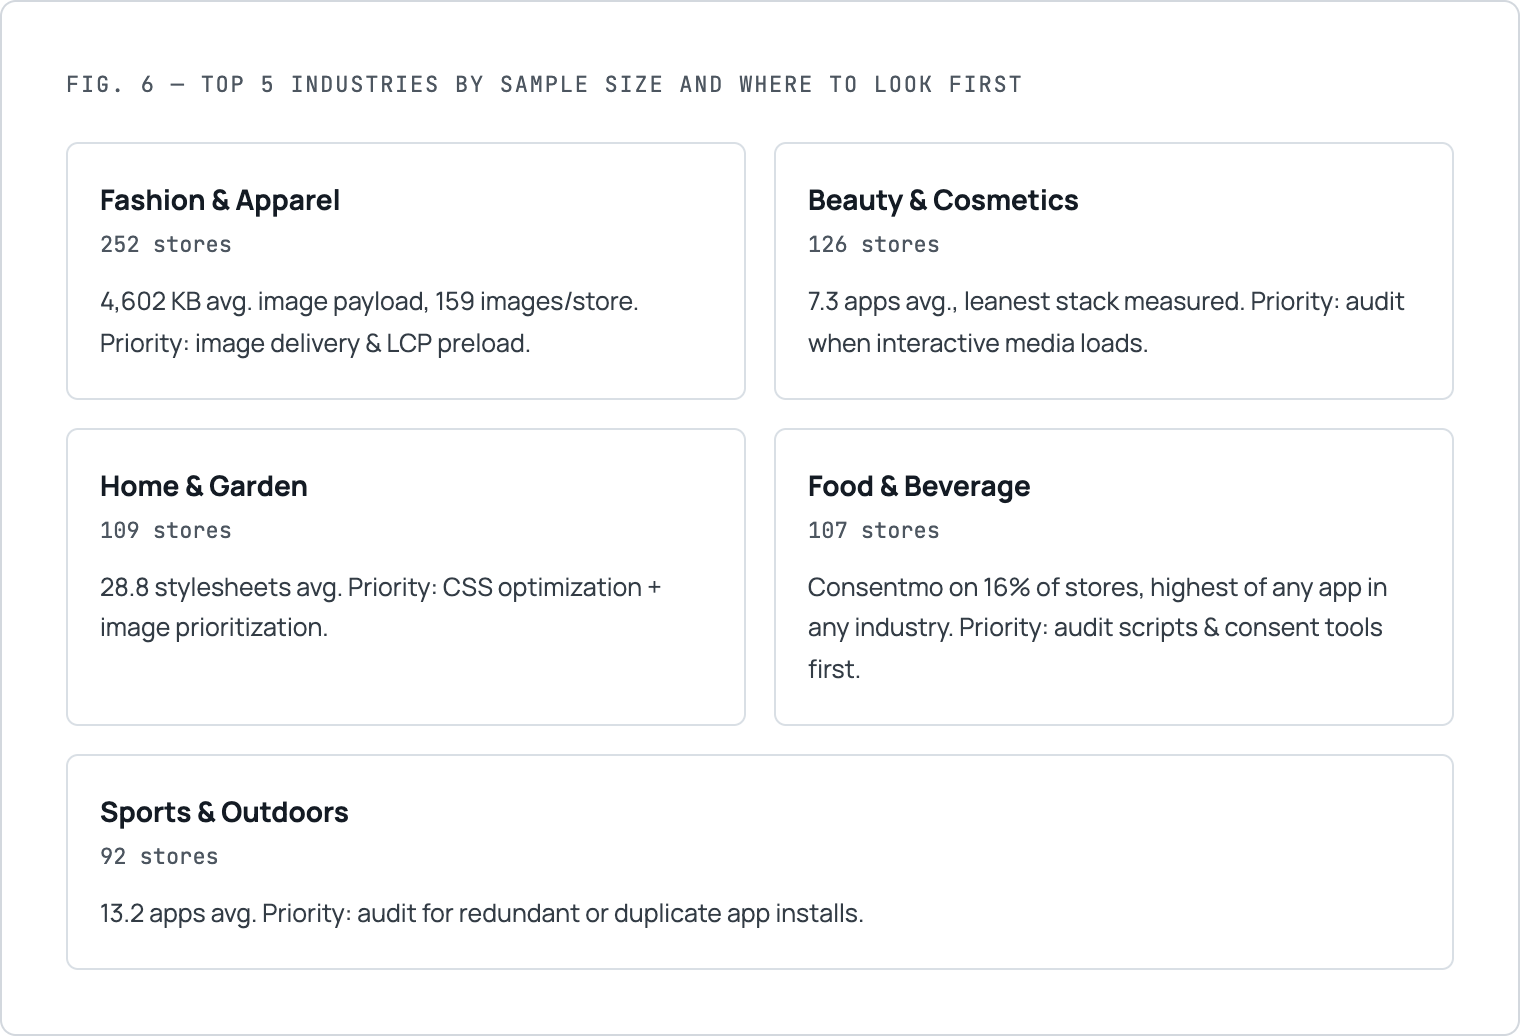
Analyzing approximately 1,200 Shopify storefronts surfaces patterns within individual industries. This isn’t a universal checklist. Different industries rely on different content, customer experiences, and third-party services, and those differences naturally influence where merchants are most likely to find meaningful improvements.
Fashion & Apparel
252 stores
Fashion was the largest category in our research and, perhaps surprisingly, one of the most revealing.
It also carried the largest average image payload of any industry we analyzed, averaging 4,602 KB per store alongside an average of 159 images. Conventional wisdom would suggest that these storefronts should consistently rank among the slowest in Shopify.
They didn’t.
Fashion finished almost exactly in the middle of the overall rankings.
That result reinforces one of the strongest conclusions from this report. Large image libraries do not automatically create slow storefronts. What matters is how efficiently those images are delivered.
The most frequently detected storefront apps in this category were:
- Swym wishlists (14%)
- Back in Stock notifications (9%)
- Judge.me reviews (8%)
- Smile.io loyalty (8%)
- Consentmo’s GDPR consent banner (8%)
None of these applications are inherently problematic. A wishlist icon doesn’t need to compete with the hero banner. A review widget doesn’t need to execute before shoppers can see the product.
Yet only 2.5% of fashion stores in our dataset preload their Largest Contentful Paint image despite carrying the heaviest visual payload of any category.
For fashion merchants, the biggest opportunities remain image delivery, responsive sizing, modern image formats, and prioritizing above-the-fold content before secondary functionality.
Beauty & Cosmetics
126 stores
Beauty and cosmetics stores showed one of the leanest application footprints among major industries, averaging just 7.3 detected storefront apps, comfortably below the overall average.
The most common applications included:
- Consentmo (9%)
- Judge.me (9%)
- promotional free gift tools (9%)
- Smile.io (7%)
That lighter app stack suggests beauty merchants face a different challenge than many other categories.
Modern beauty stores increasingly depend on interactive media to educate shoppers. Ingredient explainers, before-and-after comparisons, tutorial videos, product demonstrations, shade selectors, and interactive galleries all contribute to richer buying experiences.
They also introduce opportunities for unnecessary work during initial page load if those elements are loaded immediately regardless of whether shoppers interact with them.
The largest opportunities here often come from auditing when interactive content loads rather than removing it altogether.
Home & Garden
109 stores
Home & Garden stores displayed one of the more balanced application profiles in our dataset.
Judge.me and Smile.io each appeared on 11% of storefronts, followed by Consentmo (10%), Swym (9%), and Klaviyo (9%).
Unlike many categories built around lower-priced purchases, Home & Garden merchants often depend heavily on email marketing, browsing history, and remarketing to support longer purchase journeys. That reliance naturally introduces additional scripts into the storefront.
The category also recorded one of the higher average stylesheet counts in the study at 28.8 stylesheets per store.
Combined with large product imagery commonly used for furniture and décor, this makes CSS optimization and image prioritization particularly worthwhile.
The objective isn’t reducing visual quality. It’s ensuring that shoppers see meaningful content before decorative styling and secondary functionality consume browser resources.
Food & Beverage
107 stores
Food & Beverage presented a different profile altogether.
Consentmo appeared on 16% of stores, the highest adoption rate of any individual application within any industry we analyzed.
Review widgets, accessibility tools, and form builders rounded out the remainder of the most common technology stack.
Interestingly, this category also carried the second-lightest average image count among the five largest industries.
That combination offers a useful clue.
If a Food & Beverage storefront performs poorly despite relatively modest image libraries, merchants should investigate scripts, consent management, marketing integrations, and render-blocking resources before assuming product photography is the primary issue.
The bottleneck is often elsewhere.
Sports & Outdoors
92 stores
Sports & Outdoors stood out because of its application mix rather than its content profile.
Two separate versions of Judge.me appeared among the most frequently detected storefront technologies, alongside lb-upsell and HulkApps forms, each present on roughly 12% of stores.
The category also carried one of the higher average app counts among major industries at 13.2 detected storefront apps.
One finding deserves particular attention.
The appearance of multiple Judge.me identifiers suggests that some stores may be operating through application migrations, duplicate installations, or incomplete configuration changes.
While our dataset cannot determine the reason with certainty, merchants should periodically audit their storefront for redundant scripts and unused integrations, particularly after changing review platforms or major marketing tools.
The pattern that almost every Shopify store shares
Different merchants sell different products. Different industries prioritize different customer experiences. Yet the same third-party technologies appear across almost every category:
- Judge.me
- Smile.io
- Consentmo
- Klaviyo
- wishlist tools
- review platforms
- marketing integrations
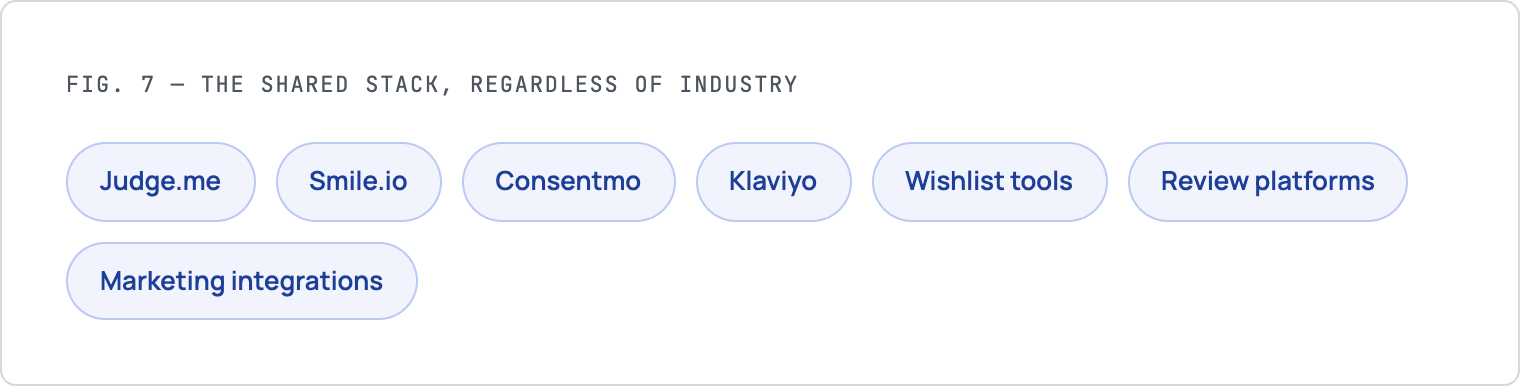
These applications have become part of the modern Shopify ecosystem because they solve real business problems. Removing them is rarely the right answer.
The more important observation is when they load. The browser doesn’t know that a product image matters more than a review carousel, or that a consent banner matters less than the page’s primary content.
Unless developers explicitly prioritize resources, everything competes for bandwidth, processing time, and rendering at the same moment.
Merchants often ask which apps they should remove. Our research suggests the better question is: which resources should load first?
What our research suggests about Shopify performance
When we began this study, we expected to identify clear differences between industries. Instead, every major explanation we tested turned out to have surprisingly little predictive power on its own.
Industry didn’t explain storefront performance. Neither did image weight, app count, or stylesheet count.
That doesn’t mean these metrics don’t matter:
- Large images can delay rendering
- Poorly optimized JavaScript can block the main thread
- Excessive CSS can postpone visual rendering
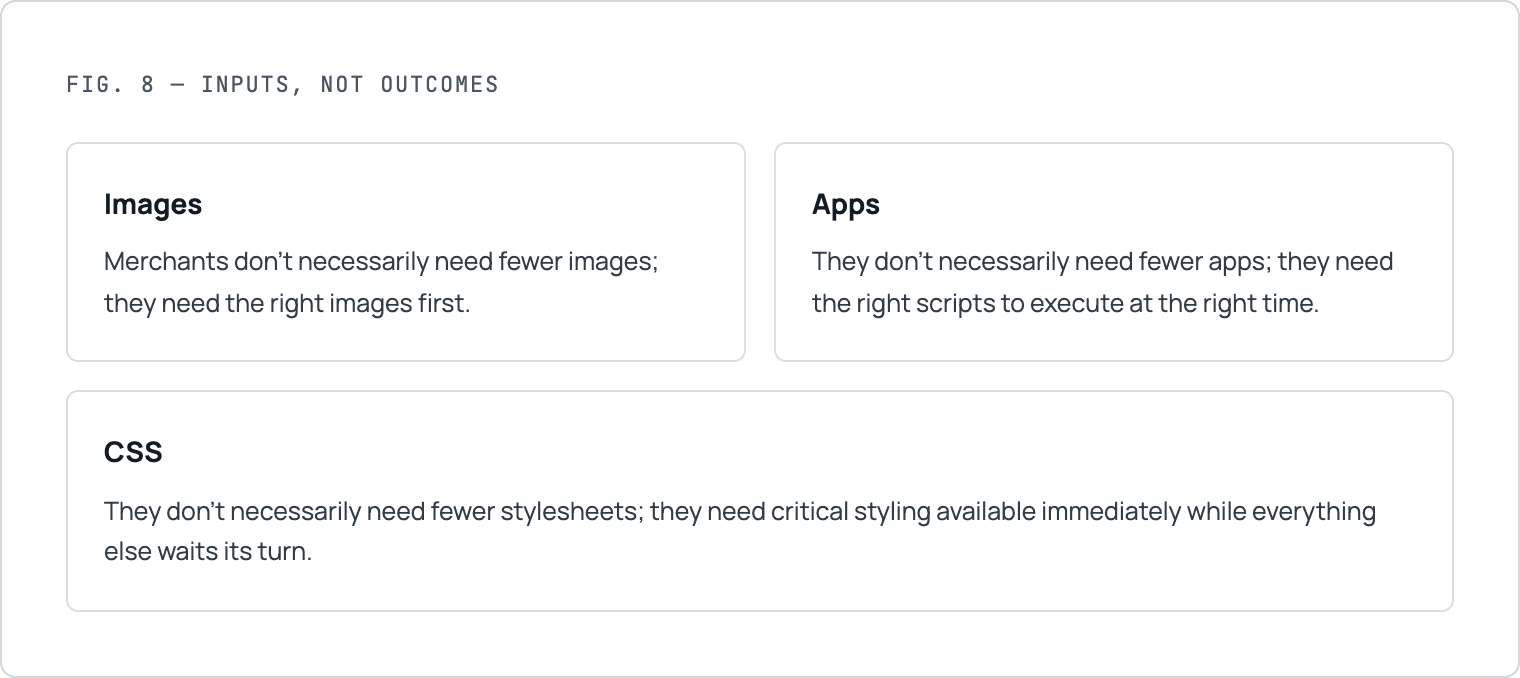
But these metrics are inputs, not outcomes. A store with hundreds of images can still feel responsive if shoppers see meaningful content immediately.
Another store with relatively few assets can feel slow if the browser spends its first seconds downloading scripts, parsing unused CSS, and executing marketing tools before rendering the product page.
- Merchants don’t necessarily need fewer images; they need the right images first.
- They don’t necessarily need fewer apps; they need the right scripts to execute at the right time.
- They don’t necessarily need fewer stylesheets; they need critical styling available immediately while everything else waits its turn.
Those decisions happen long before shoppers notice them. Customers simply experience a storefront that feels fast.
Merchants spend considerable time deciding what to install, but far less attention is given to when those resources load.
As Shopify stores mature, performance rarely declines because of a single app or oversized image. It usually erodes gradually as loyalty programs, analytics, reviews, personalization, chat, marketing pixels, and other third-party tools accumulate.
Each adds value, but without explicit prioritization, they all compete for bandwidth, CPU time, and rendering during the most critical stage of page loading.
Two merchants may use Judge.me, Klaviyo, Consentmo, and the same Shopify theme, yet one store feels responsive while the other doesn’t. The difference often lies in resource scheduling, not technology selection.
That’s why advice like “remove apps” rarely solves the problem.
A better approach is ensuring valuable features stop competing with the content shoppers came to see.
How Hyperspeed aligns with what the data found
Our research repeatedly pointed to the same underlying challenge.
Shopify stores don’t become slow simply because they have more images, apps, or CSS. They become slow when all of those resources compete for the browser’s attention at the same time.
That’s exactly the problem Hyperspeed was built to solve.
Instead of asking merchants to remove valuable functionality, Hyperspeed focuses on resource prioritization, allowing critical page content to load before secondary resources compete for bandwidth and processing time.
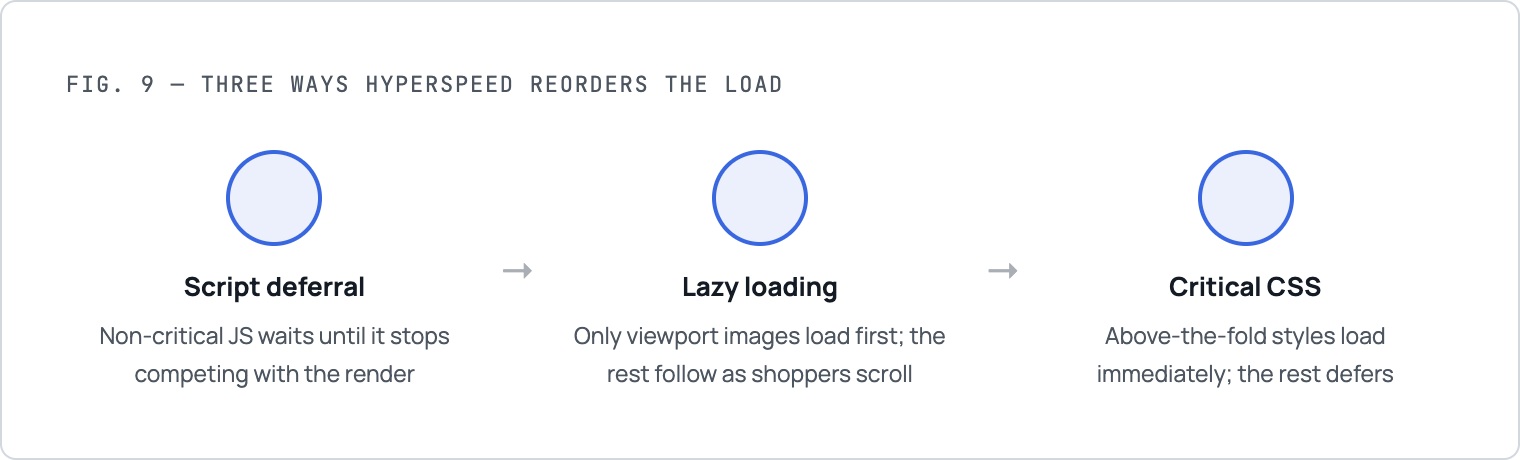
It does this in three ways:
- Script deferral postpones non-critical JavaScript, including analytics, marketing pixels, review widgets, loyalty programs, consent banners, and chat tools until they no longer interfere with the initial page render.
- Lazy loading requests only the images needed for the initial viewport, loading the rest as shoppers continue through the page.
- Critical CSS prioritizes the styles required to render above-the-fold content while deferring non-essential CSS to reduce render-blocking work that delays Largest Contentful Paint.
These optimizations don’t change what a storefront contains.
They change when the browser processes it, reflecting one of the clearest findings from this research: better performance comes less from removing functionality and more from loading the right resources at the right time.
The bigger takeaway from 1,193 Shopify stores
We began this research expecting industry to explain a significant share of Shopify performance.
It didn’t.
Across 1,193 storefronts, the strongest patterns had little to do with what merchants sold and far more to do with how their storefronts were delivered to the browser.
That’s encouraging because it means performance is shaped by technical decisions that can be measured, improved, and refined over time.
Your industry may influence how much a slow storefront costs your business.
It does not define how fast your Shopify store can be.
Run a free Hyperspeed audit to see how your store compares and uncover optimization opportunities backed by real Shopify performance data.
How fast is your Shopify store?
Compare how fast your store is to a huge sample of other stores. Get benchmarked and find out where you can improve your speed to make more sales.
FAQ
Does my Shopify industry affect my store’s speed?
No. Industry has little influence on Shopify speed compared with technical implementation. Factors such as JavaScript execution, image optimization, third-party apps, and theme efficiency have a much greater impact on Core Web Vitals, PageSpeed Insights scores, and overall user experience than the products your store sells.
Why do some Shopify stores in the same industry perform very differently?
Stores in the same industry often share similar products but differ in how they load resources. LCP, INP, CLS, JavaScript, image optimization, app bloat, and theme quality affect speed far more than category alone. Benchmark your store with both lab data and field data to identify the biggest opportunities.
What metrics should I benchmark instead of comparing my industry?
Instead of relying on industry averages, benchmark Core Web Vitals such as Largest Contentful Paint, Interaction to Next Paint, and Cumulative Layout Shift. Also monitor Time to First Byte, PageSpeed Insights, page load time, and conversion rate to understand how performance affects real shoppers.
Can third-party apps slow down a Shopify store even if I don’t install many?
Yes. A few poorly optimized third-party apps can have a greater impact than many well-managed ones. Heavy JavaScript, unnecessary requests, and app bloat can delay LCP, increase INP, and reduce mobile and desktop performance. Review every app’s loading behaviour, not just the total app count.
How can I improve Shopify speed regardless of my industry?
Start by optimizing images, reducing unnecessary JavaScript, improving responsive design, and prioritizing above-the-fold content. Measure progress with PageSpeed Insights, Core Web Vitals, and field data. Focus on faster page load time and better resource loading rather than changing your Shopify theme alone.